Today’s post is brought to you by Bedlam Coffee in Seattle.

Today’s post is brought to you by Bedlam Coffee in Seattle. It’s an old school 2nd gen coffee shop, kitschy blue collar style, very cool and very endearing. It’s a great place to chill, read a book, hack a little, or generally talk to people in the Belltown Neighborhood. It’s a good part of Seattle and in the back of my mind I have that fear it’ll be replaced by a towering condo complex and a sterile modern steel, wood, and glass something another any minute now. But for the moment it’s a prime spot to get wired into one’s mind.

Post Topics: I’m gonna hit on a number of key topics. Curious your thoughts, and as always, tweet at me via twitter, comment here, or ping me however. Always glad to chat on things.

  • Climate Leave — The second I saw this post, by Anil Dash I immediately had a few thoughts pop into my mind. The first is all companies should start recording this climate leave data point so we can have hard data on what the climate catastrophe is costing companies in hard dollar terms. It’s a way to wake up some people’s thinking to the reality of these extremities and make climate change measurable in ways they’re currently unwilling, unable, or outright refusing to accept or address. On the other side, this is a hard reality of work and life today. For instance, the regularity in which northwest cities shut down over a little snow is frequent now. But it’s only because for many decades west coast cities have existed and not prepared for such, because such just didn’t happen with regularity. So many initial thoughts, and the post itself is really good and inspires additional thinking, as one often may assume from writing Anil tends to do.
  • The difference in JVM vs CLR worlds is quite interesting states Bart Sokol. He inquired with a 280 character tweet, which I’d love to see others weigh in on how this is perceived and played out for you.

  • An overheard Oracle conv thread from yours truly happened today too. I just can’t even start with Oracle, everytime I see their tooling in play or discussed, it’s almost always followed by a giant trash fire. The company owns so much and has so much potential to do good but instead all they do is spread horrid reputation, trash systems that could help people, and fall down on their job (i.e. go check out the Oregon health care trash fire they supposedly *built*. Not to release Oregon Gov from some responsibility, but they brought in Oracle with the idea that they knew what they were doing and they ruined the project and basically sucked the project dry of funds, leaving Oregonians without in the end).

  • The Former CEO of Brightcove took the rather broken tax plan of the current GOP (or whatever oddball ghost of the GOP it is) to task. It’s a fairly solid write up of the whole matter. It leads to lots of other things one might want to look into if you’re curious about the matter.
  • In a post that I can truly relate with, M.G. Siegler heads north on the Coast Starlight and wrote a nice piece about traveling by train. Why it’s as wonderful as it is, not particularly because of the train itself but what the train provides. To note, Siegler is formerly of Google Ventures, wrote for TechCrunch and VentureBeat among others and has a pretty well connected line with the tech industry. He’s a good person to follow and read.
  • In other news, David Mytton (who got a follow on Medium and Twitter out of this post!) and team at Server Density has finished a 9 month project to migrate from Softlayer to Google Cloud. Similar to efforts I helped kick off at Home Depot and am helping others do. If you’re interested in help around migration of systems; onsite or offsite, co-location or otherwise, to Google Cloud, AWS, or Azure reach out and let me know. I’d love to talk shop about your progress and if Pelotech or I could provide a helping hand. We’ve got a lot of experience in those efforts!

Kubernetes Networking Explained & The Other Projects

Still stumbling through determining what Kubernetes does for networking? Here’s a good piece written up by Mark Betz, titled “Understanding Kubernetes Networking: Pods”. Just reading Mark’s latest on Kubernetes is great, but definitely take a look at his other writing too, it’s a steady stream of really solid material that is insightful, helpful, and well thought out. Good job Mark.

I’ve got two more blog entries on getting Kubernetes deployed and what you get with default Terraform configuration setups in Azure and AWS (The Google Cloud Platform write up is posted here). Once complete that’s a wrap for that series. Then I’m going shift gears again and start working on a number of elements around application and services (ala microservices) development.

Always staying nimble means always jumping around to the specific details of the things that need done! This, among many efforts to jump around to the specific thing that needs done, actually feels more like a return to familiar territory. After all, the vast majority of my work in the last many years has been writing code implemented against various environments to ensure reliable data access and available services for customers; customers being web front end devs, nurses in a hospitals, GIS workers resolving mapping conflicts, veterinarians, video watching patrons on the internet, or any host of someone using the software I’ve built.

In light of that, here’s a few extra thoughts and tidbits about what’s in the works next.

  • Getting the Data Diluvium Project running, a core product implemented, and usable live out there on the wild web.
  • Getting blue-land-app (It’s a Go Service), blue-world-noding (It’s a Node.js Service), and blue-world-making (It’s the infrastructure the two run on) are all working and in usable states for prospective tutorials, sample usage, and for speaking from in presentations. They’re going to be, in the end, solid examples of how to get up and running with those particular stacks + Kubernetes. A kind of a from zero to launch examples.

Other Links of Note:

Big Ole Invisible Freight Railroads (Let’s Talk Volumes)

Let’s talk about freight shipments in the United States for a moment. You often see 18-wheelers and such hauling stuff back and forth on the roadways, but did you realize they only account for just shy of 30% of freight movement in the United States? At least by ton miles carried, railroads carry a whopping 40% (see this and . That’s right — the relatively invisible, barely interruptive, much cleaner than 18-wheelers or planes — freight railroads!

Ton Miles from FRA Telemetry on Freight Systems (Referenced below in FRA DOT Link)

https://www.fra.dot.gov/Page/P0362

Let’s talk about a few other things. The road systems in the US, which have the largest amount of road damage costs attributed to weather and trucking, cost the US taxpayer over $100 billion a year. That’s often $100 billion beyond the $38–42 billion a year in gas taxes we pay (more). The railroads in the United States however rarely take any taxpayer money and rely almost solely on shipping fees paid by customers. Freight railroads are one of the only entities that actually pay the vast majority of their costs in operation, capital costs, and even beyond that, unlike those dastardly automobile hand-outs, car welfare, and related subsidies! They even contribute back to society with business expansions in communities, charity programs, and more (read here, here, and here). Overall, the freight railroads have built, continue to build, and continue to be one of the greatest industrial assets this nation or any nation has ever seen. But I do digress…


That Freight Rail Data

I didn’t actually start this post to yammer on about how cool and great the freight railroads are. I wanted to talk about some data. You see, I wanted to get hold of some interesting data. I find the massive freight movements of the railroads, and overall in the United States, rather interesting. Thus I set out on a quest to seek out and find all the data I could. This is the path and data I found, and soon you too will find this data showing up in the applications and tooling that I build and distribute — via open source projects and other means — to you dear reader!

Just for context here’s some of the details of the data I’m going to dig into. The following data is primarily monitored and managed for markets and regulatory reasons by the Government entity called the Surface Transportation Board, or STB. The STB’s website is straight up circa 1999, so it’s worth a look just for all that historical glory! Anyway, here’s the short description from the STB’s site itself.

The Surface Transportation Board is an independent adjudicatory and economic-regulatory agency charged by Congress with resolving railroad rate and service disputes and reviewing proposed railroad mergers.

The agency has jurisdiction over railroad rate and service issues and rail restructuring transactions (mergers, line sales, line construction, and line abandonments); certain trucking company, moving van, and non-contiguous ocean shipping company rate matters; certain intercity passenger bus company structure, financial, and operational matters; and rates and services of certain pipelines not regulated by the Federal Energy Regulatory Commission. The agency has authority to investigate rail service matters of regional and national significance.


The STB is one place that has a lot of regulations in which garners up a lot of data from the class I railroads. Overall these class I railroads make up the vast bulk of railroads in the United States, and also Canada and Mexico! Overall, there are over 140,000 miles of track that the railroads operate on. All built and managed by the freight railroads themselves, except for a few hundred miles in the north eastern area of the United States. For comparison that’s 140k miles of railroad and our Eisenhower Interstate Highway System is only 47,856 miles, and costs about $40–66 billion per year (amazing Quora answer w/ tons of ref links) just in maintenance and upgrades!

The defining classification of railroads in the United States by the simple designation class 1 railroad as listed on Wikipedia.

In the United States, the Surface Transportation Board defines a Class I railroad as “having annual carrier operating revenues of $250 million or more in 1991 dollars”, which adjusted for inflation was $452,653,248 in 2012.[1] According to the Association of American Railroads, Class I railroads had a minimum carrier operating revenue of $346.8 million (USD) in 2006,[2] $359 million in 2007,[3] $401.4 million in 2008,[4] $378.8 million in 2009,[5] $398.7 million in 2010[6](p1) and $433.2 million in 2011.[7]

Association of American Railroads (AAR)

The AAR provides a number of rolled up data points, tons carried totals, and many other interesting pieces of data in their data center pages. This isn’t always useful if you want data to work with, but it was one of the first sources I regularly stumbled upon in my search for actual load data and such.

The AAR also posts weekly load data totals which shows some pretty awesome graphs of ton loads and related. There are a lot of things that can be discerned from this data too. Such as, unlike Trump’s stupid declaration about something something coal this and coal that, it’s dying off as a commodity for energy.

Almost down ~40% or so from 2007.

Anyway, amidst the STB and AAR I kept digging and digging for APIs, source data, or something I could get at that had a better granularity. After almost an hour of searching this evening I realized I was getting into this mess a bit deeper than need be, but hot damn this data was fascinating. I am, after all a data nerd, so I kept digging.

I finally stumbled on something with granularity, at least daily, with YCharts. but the issue there was I had to sign up for a subscription before I could check anything out. So that was a non-starter. Especially since I didn’t even know if the granularity would go down to what I’d like to see.

Realizing that looking at regulatory bodies and related entities wasn’t going to get down into the granularity I wanted, I got curious about the individual railroads. There are only 7 class I railroads so why not dig into each specifically. Off I started on that path!

The first thing I stumbled on with this change in effort is this hilarious line, “Union Pacific’s Lynden Tennison doesn’t exactly have a problem with “Big Data.” But unlike most CIOs, he wants one.” in this post about the big data. I immediately thought to myself, “Oh LOLz do the railroads really even know the data they’re collecting, surely they do, but maybe they’re not even sure where it’s actually at!” Of course, this is entirely possible that they’re all just sitting on this treasure trove of data and it’s being squandered off in some regulatory office of bean counters versus actually being available to innovate on. For the railroads or others for that matter. Albeit I’ll give Tennison at least he’s probably on the right path, Union Pacific hasn’t been doing a bad job lately.

I then found the weekly and related reports on Union Pacific’s site under their data area. But again, this was duplicated PDF files that I saw in the AAR reports. Not very useful to work with.

As I realized this was an effort in vain, I also stumbled upon the reality that the railroads buy big hardware and software, vastly overpriced, to do very specific things with. The costs tend to be validated in operational improvements, but much of it is overpriced IBM or Oracle deals where they’re getting raked over the coals. In other words, IBM and Oracle are landing some sweet sales but the railroads aren’t. It kind of makes them all that much more impressive that they cost Americans so little actual money and provide such a massive service in return.

With that, my efforts end without success for today. But I’ve gained a few more tidbits of trivial knowledge about the STB and AAR that I oddly enough, as a fan of rail systems, didn’t have. Thus, it was kind of successful.

Oh well, back to searching for other interesting data to work with!

Build a Kubernetes Cluster on Google Cloud Platform with Terraform

terraformIn this blog entry I’m going to detail the exact configuration and cover in some additional details the collateral resources you can expect to find once the configuration is executed against with Terraform. For the repository to this write up, I create our_new_world available on Github.

First things first, locally you’ll want to have the respective CLI tools installed for Google Cloud Platform, Terraform, and Kubernetes.

Now that all the prerequisites are covered, let’s dive into the specifics of setup.

gcpIf you take a look at the Google Cloud Platform Console, it’s easy to get a before and after view of what is and will be built in the environment. The specific areas where infrastructure will be built out for Kubernetes are in the following areas, which I’ve taken a few screenshots of just to show what the empty console looks like. Again, it’s helpful to see a before and after view, it helps to understand all the pieces that are being put into place.

The first view is of the Google Compute Engine page, which currently on this account in this organization I have no instances running.

gcp-01

This view shows the container engines running. Basically this screen will show any Kubernetes clusters running, Google just opted for the super generic Google Container Engine as a title with Kubernetes nowhere to be seen. Yet.

gcp-02

Here I have one ephemeral IP address, which honestly will disappear in a moment once I delete that forwarding rule.

gcp-03

These four firewall rules are the default. The account starts out with these, and there isn’t any specific reason to change them at this point. We’ll see a number of additional firewall settings in a moment.

gcp-04

Load balancers, again, currently empty but we’ll see resources here shortly.

gcp-05

Alright, that’s basically an audit of the screens where we’ll see the meat of resources built. It’s time to get the configurations built now.

Time to Terraform Our New World

Using Terraform to build a Kubernetes cluster is pretty minimalistic. First, as I always do I add a few files the way I like to organize my Terraform configuration project. These files include:

  • .gitignore – for the requisite things I won’t want to go into the repository.
  • connections.tf – for the connection to GCP.
  • kubernetes.tf – for the configuration defining the characteristics of the Kubernetes cluster I’m working toward getting built.
  • README.md – cuz docs first. No seriously, I don’t jest, write the damned docs!
  • terraform.tfvars – for assigning variables created in variables.tf.
  • variables.tf – for declaring and adding doc/descriptions for the variables I use.

In the .gitignore I add just a few items. Some are specific to my setup that I have and IntelliJ. The contents of the file looks like this. I’ve included comments in my .gitignore so that one can easily make sense of what I’m ignoring.

# A silly MacOS/OS-X hidden file that is the bane of all repos.
.DS_Store

# .idea is the user setting configuration directory for IntelliJ, or more generally Jetbrains IDE Products.
.idea
.terraform

The next file I write up is the connections.tf file.

provider "google" {
  credentials = "${file("../secrets/account.json")}"
  project     = "thrashingcorecode"
  region      = "us-west1"
}

The path ../secrets/account.json is where I place my account.json file with keys and such, to keep it out of the repository.

The project in GCP is called thrashingcorecode, which whatever you’ve named yours you can always find right up toward the top of the GCP Console.

console-bar

Then the region is set to us-west1 which is the data centers that are located, most reasonably to my current geographic area, in The Dalles, Oregon. These data centers also tend to have a lot of the latest and greatest hardware, so they provide a little bit more oompf!

The next file I setup is the README.md, which you can just check out in the repository here.

Now I setup the variables.tf and the terraform.tfvars files. The variables.tf includes the following input and output variables declared.

// General Variables

variable "linux_admin_username" {
  type        = "string"
  description = "User name for authentication to the Kubernetes linux agent virtual machines in the cluster."
}

variable "linux_admin_password" {
  type ="string"
  description = "The password for the Linux admin account."
}

// GCP Variables
variable "gcp_cluster_count" {
  type = "string"
  description = "Count of cluster instances to start."
}

variable "cluster_name" {
  type = "string"
  description = "Cluster name for the GCP Cluster."
}

// GCP Outputs
output "gcp_cluster_endpoint" {
  value = "${google_container_cluster.gcp_kubernetes.endpoint}"
}

output "gcp_ssh_command" {
  value = "ssh ${var.linux_admin_username}@${google_container_cluster.gcp_kubernetes.endpoint}"
}

output "gcp_cluster_name" {
  value = "${google_container_cluster.gcp_kubernetes.name}"
}

In the terraform.tfvars file I have the following assigned. Obviously you wouldn’t want to keep your production Linux username and passwords in this file, but for this example I’ve set them up here as the repository sample code can only be run against your own GCP org service, so remember, if you run this you’ve got public facing default linux account credentials exposed right here!

cluster_name = "ournewworld"
gcp_cluster_count = 1
linux_admin_username = "frankie"
linux_admin_password = "supersecretpassword"

Now for the meat of this effort. The kubernetes.tf file. The way I’ve set this file up is as shown.

resource "google_container_cluster" "gcp_kubernetes" {
  name               = "${var.cluster_name}"
  zone               = "us-west1-a"
  initial_node_count = "${var.gcp_cluster_count}"

  additional_zones = [
    "us-west1-b",
    "us-west1-c",
  ]

  master_auth {
    username = "${var.linux_admin_username}"
    password = "${var.linux_admin_password}}"
  }

  node_config {
    oauth_scopes = [
      "https://www.googleapis.com/auth/compute",
      "https://www.googleapis.com/auth/devstorage.read_only",
      "https://www.googleapis.com/auth/logging.write",
      "https://www.googleapis.com/auth/monitoring",
    ]

    labels {
      this-is-for = "dev-cluster"
    }

    tags = ["dev", "work"]
  }
}

With all that setup I can now run the three commands to get everything built. The first command is terraform init. This is new with the latest releases of Terraform, which pulls down any of the respective providers that a Terraform execution will need. In this particular project it pulls down the GCP Provider. This command only needs to be run the first time before terraform plan or terraform apply are run, if you’ve deleted your .terraform directory, or if you’ve added configuration for something like Azure, Amazon Web Services, or Github that needs a new provider.

terraform-init

Now to ensure and determine what will be built, I’ll run terraform plan.

terraform-plan

Since everything looks good, time to execute with terraform apply. This will display output similar to the terraform plan command but for creating the command, and then you’ll see the countdown begin as it waits for instances to start up and networking to be configured and routed.

terraform-apply

While waiting for this to build you can also click back and forth and watch firewall rules, networking, external IP addresses, and instances start to appears in the Google Cloud Platform Console. When it completes, we can see the results, which I’ll step through here with some added notes about what is or isn’t happening and then wrap up with a destruction of the Kubernetes cluster. Keep reading until the end, because there are some important caveats about things that might or might not be destroyed during clean up. It’s important to ensure you’ve got a plan to review the cluster after it is destroyed to make sure resources and the respective costs aren’t still there.

Compute Engine View

In the console click on the compute engine option.

gcp-console-compute-engine

I’ll start with the Compute Engine view. I can see the individual virtual machine instances here and their respective zones.

gcp-console-01

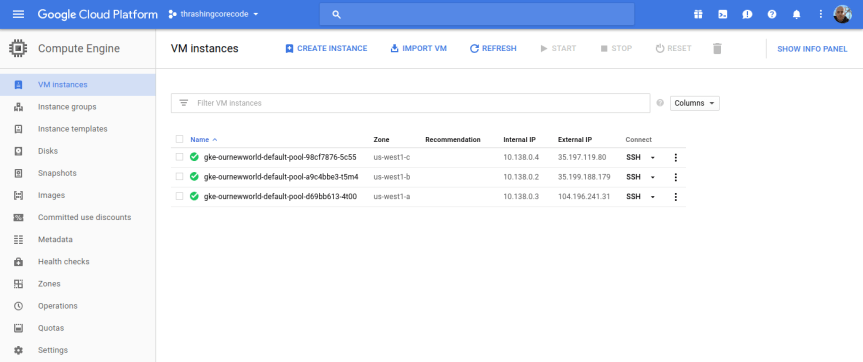
Looking at the Terraform file confiugration I can see that the initial zone to create the cluster in was used, which is us-west1-a inside the us-west1 region. The next two instances are in the respective additional_zones that I marked up in the Terraform configuration.

additional_zones = [
  "us-west1-b",
  "us-west1-c",
]

You could even add additional zones here too. Terraform during creation will create an additional virtual machine instance to add to the Kubernetes cluster for each increment that initial_node_count is set to. Currently I set mine to a variable so I could set it and other things in my terraform.tfvars file. Right now I have it set to 1 so that one virtual machine instance will be created in the initial zone and in each of the designated additional_zones.

Beyond the VM instances view click on the Instance groups, Instance templates, and Disks to seem more items setup for each of the instances in the respective deployed zones.

If I bump my virtual machine instance count up to 2, I get 6 virtual machine instances. I did this, and took a screenshot of those instances running. You can see that there are two instances in each zone now.

gcp-console-2instances-01

Instance groups

Note that an instance group is setup for each zone, so this group kind of organizes all the instances in that zone.

gcp-console-02

Instance Templates

Like the instance groups, there is one template per zone. If I setup 1 virtual machine instance or 10 in the zone, I’ll have one template that describes the instances that are created.

gcp-console-03

gcp-console-04

To SSH into any of these virtual machine instances, the easiest way is to navigate into one of the views for the instances, such as under the VM instances section, and click on the SSH button for the instance.

gcp-console-05

Then a screen will pop up showing the session starting. This will take 10-20 seconds sometimes so don’t assume it’s broken. Then a browser based standard looking SSH terminal will be running against the instance.

ssh-window-01

ssh-window-02

This comes in handy if any of the instances ends up having issues down the line. Of all the providers GCP has made connecting to instances and such with this and tools like gcloud extremely easy and quick.

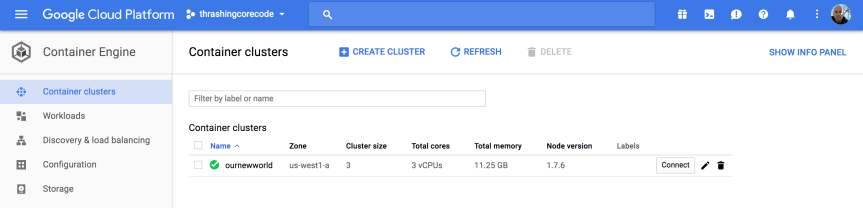
Container Engine View

In this view we have cluster specific information to check out.

gcp-console-container-clusters

Once the cluster view comes up there sits the single cluster that is built. If there are additional, they display here just like instances or other resources on other screens. It’s all pretty standard and well laid out in Google Cloud Platform fashion.

gcp-console-05

The first thing to note, in my not so humble opinion, is the Connect button. This, like on so many other areas of the console, has immediate, quick, easy ways to connect to the cluster.

gcp-console-06

Gaining access to the cluster that is now created with the commands available is quick. The little button in the top right hand corner copies the command to the copy paste buffer. The two commands execute as shown.

gcloud container clusters get-credentials ournewworld --zone us-west1-a --project thrashingcorecode

and then

kubectl proxy

gcp-console-07

With the URI posted after execution of kubectl proxy I can check out the active dashboard rendered for the container cluster at 127.0.0.1:8001/ui.

IMPORTANT NOTE: If the kubectl version isn’t up to an appropriate parity version with the server then it may not render this page ok. To ensure that the version is at parity, run a kubectl version to see what versions are in place. I recently went through troubleshooting this scenario which rendered a blank page. After trial and error it came down to version differences on server and client kubectl.

Kubernetes_Dashboard

I’ll dive into more of the dashboard and related things in a later post. For now I’m going to keep moving forward and focus on the remaining resources built, in networking.

VPC Network

gcp-console-09

Once the networking view renders there are several key tabs on the left hand side; External IP addresses, Firewall rules, and Routes.

External IP Addresses

Setting and using external IP addresses allow for routing to the various Kubernetes nodes. Several ephemeral IP addresses are created and displayed in this section for each of the Kubernetes nodes. For more information check out the documentation on reserving a static external IP address and reserving an internal IP address.

gcp-console-11

Firewall Rules

In this section there are several new rules added for the cluster. For more information specific to GCP firewall rules check out the documentation about firewall rules.

gcp-console-12

Routes

Routes are used to setup paths mapping an IP range to a destination. Routes setup a VPC Networks where to send packets for a particular IP address. For more information about documentation route details.

gcp-console-13

Each of these sections have new resources built and added as shown above. More than a few convention based assumptions are made with Terraform.

Next steps…

In my next post I’ll dive into some things to setup once you’ve got your Kubernetes cluster. Setting up users, getting a continuous integration and delivery build started, and more. I’ll also be writing up another entry, similar to this for AWS and Azure Cloud Providers. If you’d like to see Kubernetes setup and a tour of the setup with Terraform beyond the big three, let me know and I’ll add that to the queue. Once we get past that there are a number of additional Kubernetes, containers, and dev specific posts that I’ll have coming up. Stay tuned, subscribe to the blog feed or follow @ThrashingCode for new blog posts.

Resources:


Speaking, Follow Up, and Improving

Recently I did a series of talks focused around building Kubernetes Clusters. In these I demoed how Terraform can be used to build out a Kubernetes cluster and then ideas for working with that Kubernetes cluster or building out other infrastructure with Terraform around the Kubernetes cluster. I’ve posted the first of several posts that I’m putting together related to the configuration, code, and work I did for those talks.

On this topic there are several additional things I try to do for and after every presentation I give. This adds value for me, the people who attend the presentation, but also for others that did not attend after the talk. At least, that’s my intent and hope in this and related follow up material. Here’s the breakdown of what I try to do with every presentation. Below I’ll also have links to presentations I have succeeded in accomplishing this mission.

Mission Goals

The mission goals involves getting the presentation posted along with other key goals upon notification of date, time, and related details to several key places:

  1. Calendar — Post to my speaking and meetup calendar here.
  2. RSVP Site — Next I ensure it is listed on meetup or whatever site the organizers are using.
  3. Composite Code Blog Listing — Next I create a page where I will put all of the collateral for the presentation and list it on this page. Often this starts out merely as a listing and then a link to the page where I’ll simply write “Content are TBD but actively being developed! Stay tuned!
  4. Presentation Page — Then for each presentation I give I create a singular page to post and collect all the collateral elements. This is the page that the listing in #3 points to. Some examples include; “Elasticsearch with Terraform, Packer, and Immutability Magic” or “Terraform, Packer, Atlas @ The Orange Retailer”.
  5. Code, Slide Deck, Collateral — Other elements I make ever effort to include code repositories (usually on Github), image or slide deck files, and anything else I used to demonstrate during the presentation.

Presentations That Accomplish This Mission

There are a few of these presentations I’ve given that have had every mission criteria met. Here I’ve linked a few just to point out what a finished presentation and follow up looks like. At least, these are examples of what I aim for, there are always ways to improve on this.

  1. Managing (or not) The Data in Immutable Infrastructure — includes slides, a short write up, video, and related collateral.
  1. Organizing Infrastructure Config & Workflow— includes slides, and very thorough write up, video, etc.
  1. Visual Studio AWS Tooling & SDK — Even though this is a presentation from a different era of technology, it still represents all the pieces collected for a successful mission. Video, write up, and collateral repo and such. I’d be curious, since it has been such a long time, if the code still runs.

That’s that, and onward and forward to the next code challenge. I’ll be publishing that shortly on my blog, at https://compositecode.blog/.