ASP.NET MVC Scorecard Web Application – Part 3

In this entry I want to cover a helper I wrote and some other bits to simplify creating charts for the scorecard application.

One of the things I wanted to do was get rid of the excessive amount of code needed in the view to generate various charts.  Since at some point I wanted to be able to dynamically create charts based on user input, I figured what better time than now to start chiseling out a helper class for displaying the charts.

Take the pie chart I created in the last entry.  The code in the view looked like this.

using (Chart chartPie = new Chart())
{
    double[] yValues = (double[])ViewData["TopCountryCounts"];
    string[] xValues = (string[])ViewData["TopCountries"];
 
    Title t = new Title("Pie Chart Representation",
        Docking.Top,
        new System.Drawing.Font("Verdana, Helvetica, Sans-Serif", 14, System.Drawing.FontStyle.Bold),
        System.Drawing.Color.FromArgb(26, 59, 105));
    chartPie.Titles.Add(t);
    chartPie.ChartAreas.Add("Default");
 
    // create a couple of series
    chartPie.Series.Add("Default");
    chartPie.Series["Default"].Points.DataBindXY(xValues, yValues);
 
    // Set Doughnut chart type
    chartPie.Series["Default"].ChartType = SeriesChartType.Pie;
 
    // Set labels style
    chartPie.Series["Default"]["PieLabelStyle"] = "Inside";
    // Set Doughnut radius percentage
    chartPie.Series["Default"]["DoughnutRadius"] = "40";
    // Explode data point with label "USA"
    chartPie.Series["Default"].Points[3]["Exploded"] = "true";
 
    chartPie.Width = 400;
    chartPie.Height = 300;
    chartPie.Page = this;
    HtmlTextWriter writer = new HtmlTextWriter(Page.Response.Output);
    chartPie.RenderControl(writer);
}

.csharpcode, .csharpcode pre
{
font-size: small;
color: black;
font-family: consolas, “Courier New”, courier, monospace;
background-color: #ffffff;
/*white-space: pre;*/
}
.csharpcode pre { margin: 0em; }
.csharpcode .rem { color: #008000; }
.csharpcode .kwrd { color: #0000ff; }
.csharpcode .str { color: #006080; }
.csharpcode .op { color: #0000c0; }
.csharpcode .preproc { color: #cc6633; }
.csharpcode .asp { background-color: #ffff00; }
.csharpcode .html { color: #800000; }
.csharpcode .attr { color: #ff0000; }
.csharpcode .alt
{
background-color: #f4f4f4;
width: 100%;
margin: 0em;
}
.csharpcode .lnum { color: #606060; }

At 31 lines of code, I was not really stoked about this.  A lot of this, such as creating the title, the chart area, and having a series was something that would be needed by most charts.  With that I went to work writing a set of tests to test the helper class.

public const string title = "Chart Title";
public double[] YValues = {3};
public string[] XValues = {"X Value"};
 
[TestMethod]
public void InstantiateChartHelper()
{
    ChartHelper chartHelper = new ChartHelper("title", YValues, XValues, SeriesChartType.Pie);
    Assert.IsNotNull(chartHelper);
}

.csharpcode, .csharpcode pre
{
font-size: small;
color: black;
font-family: consolas, “Courier New”, courier, monospace;
background-color: #ffffff;
/*white-space: pre;*/
}
.csharpcode pre { margin: 0em; }
.csharpcode .rem { color: #008000; }
.csharpcode .kwrd { color: #0000ff; }
.csharpcode .str { color: #006080; }
.csharpcode .op { color: #0000c0; }
.csharpcode .preproc { color: #cc6633; }
.csharpcode .asp { background-color: #ffff00; }
.csharpcode .html { color: #800000; }
.csharpcode .attr { color: #ff0000; }
.csharpcode .alt
{
background-color: #f4f4f4;
width: 100%;
margin: 0em;
}
.csharpcode .lnum { color: #606060; }

This first test and default values, that I assumed I would use for the other tests, got me a nice skeleton class & constructor.  I used ReSharper to flesh it out a little and then went to writing the other tests.  Each contributing a bit more functionality to the overall class.  I have excluded the remaining tests from this blog entry, but they will be available when I provide the solution for download (that means keep reading and stay tuned).  The class however, that ended up with is below.

public class ChartHelper
{
    public ChartHelper(string chartTitle, IEnumerable<double> seriesValues, IEnumerable<string> seriesKeys, SeriesChartType chartType)
    {
        // Setup defaults.
        System.Drawing.Font font = new System.Drawing.Font("Verdana, Helvetica, Sans-Serif", 14, System.Drawing.FontStyle.Bold);
        System.Drawing.Color color = System.Drawing.Color.FromArgb(26, 59, 105);
 
        // Title
        Title title = new Title(chartTitle, Docking.Top, font, color);
       
        // Chart Area
        ChartArea chartArea = new ChartArea("DefaultChartArea");
        chartArea.Area3DStyle.Enable3D = true;
        
        // Series
        Series series = new Series("DefaultSeries");
        series.Points.DataBindXY(seriesKeys, seriesValues);
        series.ChartType = chartType;
 
        ResultingChart = new Chart();
        ResultingChart.Titles.Add(title);
        ResultingChart.ChartAreas.Add(chartArea);
        ResultingChart.Series.Add(series);
        
    }
 
    public Chart ResultingChart { get; set; }
}

.csharpcode, .csharpcode pre
{
font-size: small;
color: black;
font-family: consolas, “Courier New”, courier, monospace;
background-color: #ffffff;
/*white-space: pre;*/
}
.csharpcode pre { margin: 0em; }
.csharpcode .rem { color: #008000; }
.csharpcode .kwrd { color: #0000ff; }
.csharpcode .str { color: #006080; }
.csharpcode .op { color: #0000c0; }
.csharpcode .preproc { color: #cc6633; }
.csharpcode .asp { background-color: #ffff00; }
.csharpcode .html { color: #800000; }
.csharpcode .attr { color: #ff0000; }
.csharpcode .alt
{
background-color: #f4f4f4;
width: 100%;
margin: 0em;
}
.csharpcode .lnum { color: #606060; }

As you can see, a nice simple class.  With this class I was then able to use to reduce my lines of code to 9 lines (including the multi-line instantiation, which I suppose could be one line, leaving me with 6).

Scorecard.Views.ChartHelper chartHelper = new Scorecard.Views.ChartHelper("Pie Chart Representation",
   (double[])ViewData["TopCountryCounts"],
   (string[])ViewData["TopCountries"],
   SeriesChartType.Pie);
Chart chartPieTwo = chartHelper.ResultingChart;
 
chartPieTwo.Page = this;
HtmlTextWriter writer1 = new HtmlTextWriter(Page.Response.Output);
chartPieTwo.RenderControl(writer1);

.csharpcode, .csharpcode pre
{
font-size: small;
color: black;
font-family: consolas, “Courier New”, courier, monospace;
background-color: #ffffff;
/*white-space: pre;*/
}
.csharpcode pre { margin: 0em; }
.csharpcode .rem { color: #008000; }
.csharpcode .kwrd { color: #0000ff; }
.csharpcode .str { color: #006080; }
.csharpcode .op { color: #0000c0; }
.csharpcode .preproc { color: #cc6633; }
.csharpcode .asp { background-color: #ffff00; }
.csharpcode .html { color: #800000; }
.csharpcode .attr { color: #ff0000; }
.csharpcode .alt
{
background-color: #f4f4f4;
width: 100%;
margin: 0em;
}
.csharpcode .lnum { color: #606060; }

This now generates the following pie chart.
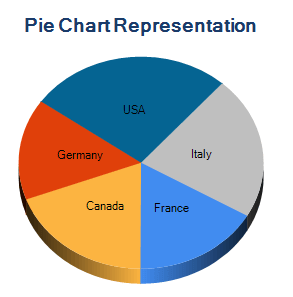
There are a few more defaults I want to set though, so I went ahead and added a logic section for pie charts as shown below, with the switch view to provide a bit of factory style magic.

ResultingChart = new Chart();
 
// Setup defaults.
System.Drawing.Font font = new System.Drawing.Font("Verdana, Helvetica, Sans-Serif", 14, System.Drawing.FontStyle.Bold);
System.Drawing.Color color = System.Drawing.Color.FromArgb(26, 59, 105);
 
// Title
Title title = new Title(chartTitle, Docking.Top, font, color);
ResultingChart.Titles.Add(title);
 
// Chart Area
ChartArea chartArea = new ChartArea("DefaultChartArea") {Area3DStyle = {Enable3D = true}};
ResultingChart.ChartAreas.Add(chartArea);
 
// Series
Series series = new Series("DefaultSeries");
series.Points.DataBindXY(seriesKeys, seriesValues);
series.ChartType = chartType;
ResultingChart.Series.Add(series);
 
// Legend
Legend legend = new Legend("DefaultLegend");
ResultingChart.Legends.Add(legend);
 
switch (chartType)
{
    case SeriesChartType.Bar:
        break;
    case SeriesChartType.Column:
        break;
    case SeriesChartType.Pie:
        series["PieLabelStyle"] = "Inside";
        ResultingChart.Legends[0].Docking = Docking.Bottom;
        ResultingChart.Legends[0].Enabled = true;
        break;
    case SeriesChartType.Funnel:
        break;
    case SeriesChartType.Line:
        break;
    default:
        throw new ArgumentOutOfRangeException("chartType");
}
 
ResultingChart.Width = 400;
ResultingChart.Height = 300;

.csharpcode, .csharpcode pre
{
font-size: small;
color: black;
font-family: consolas, “Courier New”, courier, monospace;
background-color: #ffffff;
/*white-space: pre;*/
}
.csharpcode pre { margin: 0em; }
.csharpcode .rem { color: #008000; }
.csharpcode .kwrd { color: #0000ff; }
.csharpcode .str { color: #006080; }
.csharpcode .op { color: #0000c0; }
.csharpcode .preproc { color: #cc6633; }
.csharpcode .asp { background-color: #ffff00; }
.csharpcode .html { color: #800000; }
.csharpcode .attr { color: #ff0000; }
.csharpcode .alt
{
background-color: #f4f4f4;
width: 100%;
margin: 0em;
}
.csharpcode .lnum { color: #606060; }

Notice I also reorganized where some things where instantiated, such as the Chart Object, and organized the order according to each thing I needed to have for the chart.  Once I did this I ran and rendered the chart, which I was happy with for now.

At this point I went back in and added some more charts to my scorecard view.  While I did this I noticed one last thing I ought to refactor.

<table>
<tr>
<td>
    <%
        Scorecard.Views.ChartHelper chartHelper = new Scorecard.Views.ChartHelper("Top Countries",
           (double[])ViewData["TopCountryCounts"],
           (string[])ViewData["TopCountries"],
           SeriesChartType.Pie);
        Chart chartPieTwo = chartHelper.ResultingChart;
 
        // Explode data point with label "USA"
        chartPieTwo.Series["DefaultSeries"].Points[3]["Exploded"] = "true";
 
        chartPieTwo.Page = this;
        HtmlTextWriter writer = new HtmlTextWriter(Page.Response.Output);
        chartPieTwo.RenderControl(writer);
    %>
</td>
<td>
    <%
        chartHelper = new Scorecard.Views.ChartHelper("View Cart Trend",
           (double[])ViewData["LineValues"],
           (string[])ViewData["TopEngines"],
           SeriesChartType.Line);
 
        Chart lineChart = chartHelper.ResultingChart;
 
        lineChart.Page = this;
        lineChart.RenderControl(writer);
    %>
</td>
</tr>
<tr>
<td>
    <%
        chartHelper = new Scorecard.Views.ChartHelper("Yesterday's Page Views",
         (double[])ViewData["ColumnStats"],
         (string[])ViewData["ColumnStatHeaders"],
         SeriesChartType.Column);
 
        Chart columnChart = chartHelper.ResultingChart;
 
        columnChart.Page = this;
        columnChart.RenderControl(writer);
    %>
</td>
<td>
    <%
        double[] theValues = (double[]) ViewData["ColumnStats"];
        double[] newValues = new double[]{0,0,0,0};
        int count = 0;
        foreach(double d in theValues)
        {
            newValues[count] += d*DateTime.DaysInMonth(DateTime.Now.Year, DateTime.Now.Month) +
                                DateTime.Now.Month + DateTime.Now.Millisecond;
            
            count++;
        }
 
        chartHelper = new Scorecard.Views.ChartHelper("Current Month Page Views",
    newValues,
    (string[])ViewData["ColumnStatHeaders"],
    SeriesChartType.Bar);
 
        Chart barChart = chartHelper.ResultingChart;
 
        barChart.Page = this;
        barChart.RenderControl(writer);
    %>
</td>
</tr>
</table>

.csharpcode, .csharpcode pre
{
font-size: small;
color: black;
font-family: consolas, “Courier New”, courier, monospace;
background-color: #ffffff;
/*white-space: pre;*/
}
.csharpcode pre { margin: 0em; }
.csharpcode .rem { color: #008000; }
.csharpcode .kwrd { color: #0000ff; }
.csharpcode .str { color: #006080; }
.csharpcode .op { color: #0000c0; }
.csharpcode .preproc { color: #cc6633; }
.csharpcode .asp { background-color: #ffff00; }
.csharpcode .html { color: #800000; }
.csharpcode .attr { color: #ff0000; }
.csharpcode .alt
{
background-color: #f4f4f4;
width: 100%;
margin: 0em;
}
.csharpcode .lnum { color: #606060; }
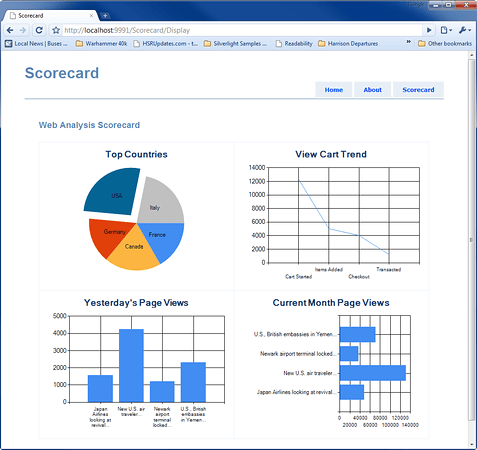
I was assigning the page and rendering the control at every single section within my table.  I didn’t need to do that, so I went back and added a render method to the ChartHelper Class.

public void RenderChart(Page page)
{
    ResultingChart.Page = page;
    HtmlTextWriter writer = new HtmlTextWriter(page.Response.Output);
    ResultingChart.RenderControl(writer);
}

.csharpcode, .csharpcode pre
{
font-size: small;
color: black;
font-family: consolas, “Courier New”, courier, monospace;
background-color: #ffffff;
/*white-space: pre;*/
}
.csharpcode pre { margin: 0em; }
.csharpcode .rem { color: #008000; }
.csharpcode .kwrd { color: #0000ff; }
.csharpcode .str { color: #006080; }
.csharpcode .op { color: #0000c0; }
.csharpcode .preproc { color: #cc6633; }
.csharpcode .asp { background-color: #ffff00; }
.csharpcode .html { color: #800000; }
.csharpcode .attr { color: #ff0000; }
.csharpcode .alt
{
background-color: #f4f4f4;
width: 100%;
margin: 0em;
}
.csharpcode .lnum { color: #606060; }

With a small change to the view I can now render each chart with one line of code.

chartHelper.RenderChart(this);

.csharpcode, .csharpcode pre
{
font-size: small;
color: black;
font-family: consolas, “Courier New”, courier, monospace;
background-color: #ffffff;
/*white-space: pre;*/
}
.csharpcode pre { margin: 0em; }
.csharpcode .rem { color: #008000; }
.csharpcode .kwrd { color: #0000ff; }
.csharpcode .str { color: #006080; }
.csharpcode .op { color: #0000c0; }
.csharpcode .preproc { color: #cc6633; }
.csharpcode .asp { background-color: #ffff00; }
.csharpcode .html { color: #800000; }
.csharpcode .attr { color: #ff0000; }
.csharpcode .alt
{
background-color: #f4f4f4;
width: 100%;
margin: 0em;
}
.csharpcode .lnum { color: #606060; }

Now that puts everything in a better situation.  Until the next part.  Happy coding.

Square, Analytics, and Some Insight

Square

I was fumbling through my RSS feeds reading a few entries and found this one.  One of the quotes quoted in this article sums up a massive shift in business in the US.

"I can buy an iPod touch] for $200, get the app and I'm in business. I don't need a contract with AT&T or anything. I'm in business.  – Jack Dorsey in The Economist "

Think about that for a minute.  This brings a massive amount of consumer power back to the individual.  This brings back something that had been gone for a while now.  There are of course, hurdles to be leapt, bureaucracy to avoid, and other unseen glitches in this shift but the possibilities are awe inspiring for sure.

A number of my fellow developers & other assorted friends have mentioned Square.  I have not used it yet, nor have they, but we each see unique possibilities.  I for one, just like the straight forward, clean, and easy interaction the service has with customers.  That alone is refreshing.

Another friend has pointed out the empowering nature for smaller businesses.  This is really part of a shift that has been occurring, but now brings home the concept decisively.  Anybody can get hold of a iPhone, Droid, or otherwise and utilize something like Square.  Someone could run a transaction in their living room if they're selling their couch, or their TV, and run it against someone else's credit card.  That is an awesome idea.

Web Analytics, Please Toss the Waterfall

Over on the Web Analytics Demystified Blog, John Lovett inspires a Manifesto for Web Analytics.  Reading the Manifesto draws attention to another idea that keeps popping into my mind about the larger analytics realm into which web analytics is really becoming.  Web analytics is type specific to the web, but in reality it reaches well beyond that now.  If not in function in ideal, and bridging that ideal into a central analytics view for a marketing department, executive staff, or whoever needs the information available for decisions to be made.  Each of John's points of the manifesto are well laid out.

Several of the points; Listen to your constituents, roll up your sleeves, assimilate to the culture, and others point out something that many software developers may simply think of as good individual Agile Practices.

#7 however really hits home with me.  Actually solve the problem, John writes.  Too often, too many groups simply band aid things.  Of course, there are always times when band aids will do just fine.  But a simple test is to ask, will you throw away this solution?  If you do not intend to throw away the solution in the near future, then following #7, is fundamental to ongoing success.  I will just add, be proactive, solve the problem.

#8 I read with some disdain.  Waterfall, being a software developer, is a vulgar word in so many ways.  The Waterfall methodology has sunk more projects, wasted more millions, blown schedules, and all in all been a poor practice in software development.  HOWEVER, John is not talking about the Waterfall Methodology.  But boy did it trigger a negative response from me at first.  I have helped out John here and removed the vulgarity and put in place a more software developer friendly word.

Strategy Credo #8: Establish a central mind-map strategy. By this I mean strategy should flow from the headwaters of the organization and align with the corporate goals set forth by the executive team. Once your measurement team is clear and united on the goals, then identify objectives as the next tier in your central mind-map that supports the corporate goals (these are your business promises).

etc, etc, etc…  you get the idea at this point.  đŸ™‚  Note:  John, I'm just giving you gruf, please don't take any offense.  đŸ˜‰

That is it from me today.  Hope all have a great first work day of 2010.  Cheers!

Mathz

Where am I headed?  A lot of shifts are taking place in my life right now, one of the most notable is some slightly different directions in technology I?m making.  There are certain bits that are staying the same;  I will keep learning as fast as I can, stay on the bleeding edge of technology, and probably stay primarily within the Microsoft stack.  The biggest change will be a more dedicated approach to UI, UX, Charts & Chart Rendering, and the math that goes into that.  With Microsoft's release of Expression into the MSDN that has encouraged me to step beyond my normal UI & UX work into these new realms.

So what does this do for me?  A number of things really.

  1. My analytics work dictates usage of many charts, and some charts that are sometimes complex.  The more layers and spines of data, the more one needs better and more descriptive charts.
  2. Financial, analytics, statistical, and other math doesn?t escape high demand.  There is always some entity, person, company, or a desire to have better data, more accurate information, more correlations, increased understanding.  Combining financial, analytics, statistical, and other mathematical practices into my work I bring even more of these demands to my supply of skills.
  3. I am promising myself to finally meet promises I have posted on this blog, and expand my reach.  I haven't done nearly as much as I would have liked to, I am more dedicated now than ever to make what I want happen.  I have been surfing long enough, not that I won't do a fair amount of surfing, if given the opportunity, it is important to the mental accuity and sanity of my person đŸ˜‰
  4. I definitely intend to get more involved in the Web Analytics Industry.  I have too many ideas and knowledge about this industry to not share what I know.  Beyond that, I am sure there are even more ideas and knowledge to be built upon mine, expanded by others that I hope to interact with in the future.

These may sound like new years resolutions or some mumbo jumbo, but I deny that resolutely.  These are simply things I will be working on in the future.

ASP.NET MVC Scorecard Web Application – Part 2

Alright, time to add some actual functionality to this thing.  First I want a report showing up on the scorecard page that has already been created.  I don’t really care what it displays, just want to get it working and displaying.  I will get one report working and then pull up others and connect them with actual data from the Model.

First things first I grabbed the MS Charting controls, which you will need to follow along with this section of code.  I assume for the rest of this entry that the charting controls are installed.

First off I created some nice fake data in a DataTable.  The object I created is below.  This is located in the Models path for now.  Just to get this mocked up.

public class ReportSampleData
{
    public ReportSampleData()
    {
        SampleData = new DataTable("Adron's Sample Data");
 
        SampleData.Columns.Add(new DataColumn("Col1"));
        SampleData.Columns.Add(new DataColumn("Col2"));
        SampleData.Columns.Add(new DataColumn("Col3"));
        SampleData.Columns.Add(new DataColumn("Col4"));
 
        DataRow dr1 = SampleData.NewRow();
        dr1[0] = "Sample Set 1";
        dr1[1] = 14;
        dr1[2] = 13;
        dr1[3] = 10;
        DataRow dr2 = SampleData.NewRow();
        dr2[0] = "Sample Set 2";
        dr2[1] = 15;
        dr2[2] = 13;
        dr2[3] = 12;
        DataRow dr3 = SampleData.NewRow();
        dr3[0] = "Sample Set 2";
        dr3[1] = 17;
        dr3[2] = 11;
        dr3[3] = 9;
 
        SampleData.Rows.Add(dr1);
        SampleData.Rows.Add(dr2);
        SampleData.Rows.Add(dr3);
    }
 
    public DataTable SampleData { get; set; }
}

.csharpcode, .csharpcode pre
{
font-size: small;
color: black;
font-family: consolas, “Courier New”, courier, monospace;
background-color: #ffffff;
/*white-space: pre;*/
}
.csharpcode pre { margin: 0em; }
.csharpcode .rem { color: #008000; }
.csharpcode .kwrd { color: #0000ff; }
.csharpcode .str { color: #006080; }
.csharpcode .op { color: #0000c0; }
.csharpcode .preproc { color: #cc6633; }
.csharpcode .asp { background-color: #ffff00; }
.csharpcode .html { color: #800000; }
.csharpcode .attr { color: #ff0000; }
.csharpcode .alt
{
background-color: #f4f4f4;
width: 100%;
margin: 0em;
}
.csharpcode .lnum { color: #606060; }

Once I created the fake data, I dropped in the chart control into the Display.aspx view under the Scorecard Directory of the views.

<%@ Page Language="C#" MasterPageFile="~/Views/Shared/Site.Master" Inherits="System.Web.Mvc.ViewPage" %>
 
<%@ Register Assembly="System.Web.DataVisualization, Version=3.5.0.0, Culture=neutral, PublicKeyToken=31bf3856ad364e35"
    Namespace="System.Web.UI.DataVisualization.Charting" TagPrefix="asp" %>
<asp:Content ID="Content1" ContentPlaceHolderID="TitleContent" runat="server">
    Scorecard
</asp:Content>
<asp:Content ID="Content2" ContentPlaceHolderID="MainContent" runat="server">
    <form id="form1" runat="server">
    <h2>
        Scorecard
    </h2>
    <%
        using (Chart chartColumns = new Chart())
        {
            chartColumns.Width = 412;
            chartColumns.Height = 296;
            chartColumns.RenderType = RenderType.ImageTag;
           
            chartColumns.Palette = ChartColorPalette.None;
            Title t = new Title("Column Bar Chart",
                Docking.Top,
                new System.Drawing.Font("Verdana, Helvetica, Sans-Serif", 14, System.Drawing.FontStyle.Bold),
                System.Drawing.Color.FromArgb(26, 59, 105));
            chartColumns.Titles.Add(t);
            chartColumns.ChartAreas.Add("Series 1");
 
            // create a couple of series  
            chartColumns.Series.Add("Series 1");
            chartColumns.Series.Add("Series 2");
 
            // add points to series 1  
            foreach (int value in (List<int>)ViewData["Chart"])
            {
                chartColumns.Series["Series 1"].Points.AddY(value + DateTime.Now.Second);
            }
 
            // add points to series 2  
            foreach (int value in (List<int>)ViewData["Chart"])
            {
                chartColumns.Series["Series 2"].Points.AddY(value + DateTime.Now.Minute);
            }
           
            chartColumns.Legends.Add("Legend1");
            chartColumns.BorderSkin.SkinStyle = BorderSkinStyle.None;
            
            // Render chart control  
            chartColumns.Page = this;
            HtmlTextWriter writer = new HtmlTextWriter(Page.Response.Output);
            chartColumns.RenderControl(writer);
        }
    %>
    </form>
</asp:Content>

.csharpcode, .csharpcode pre
{
font-size: small;
color: black;
font-family: consolas, “Courier New”, courier, monospace;
background-color: #ffffff;
/*white-space: pre;*/
}
.csharpcode pre { margin: 0em; }
.csharpcode .rem { color: #008000; }
.csharpcode .kwrd { color: #0000ff; }
.csharpcode .str { color: #006080; }
.csharpcode .op { color: #0000c0; }
.csharpcode .preproc { color: #cc6633; }
.csharpcode .asp { background-color: #ffff00; }
.csharpcode .html { color: #800000; }
.csharpcode .attr { color: #ff0000; }
.csharpcode .alt
{
background-color: #f4f4f4;
width: 100%;
margin: 0em;
}
.csharpcode .lnum { color: #606060; }

Once that was finished the final step is to toss in the controller the view data.

public ActionResult Display()
{
    ViewData["Chart"] = new List<int>() {4, 6, 12, 3, 11};
    return View("Display");
}

.csharpcode, .csharpcode pre
{
font-size: small;
color: black;
font-family: consolas, “Courier New”, courier, monospace;
background-color: #ffffff;
/*white-space: pre;*/
}
.csharpcode pre { margin: 0em; }
.csharpcode .rem { color: #008000; }
.csharpcode .kwrd { color: #0000ff; }
.csharpcode .str { color: #006080; }
.csharpcode .op { color: #0000c0; }
.csharpcode .preproc { color: #cc6633; }
.csharpcode .asp { background-color: #ffff00; }
.csharpcode .html { color: #800000; }
.csharpcode .attr { color: #ff0000; }
.csharpcode .alt
{
background-color: #f4f4f4;
width: 100%;
margin: 0em;
}
.csharpcode .lnum { color: #606060; }

Now run the app and check out the page.  You should see a chart like that shown below.  (Click for larger image)

That covers the second part of this series.  I will have another addition up soon, tying even more bits together.

Shout it

kick it on DotNetKicks.com

ASP.NET MVC Scorecard Web Application – Part 1

There have been a lot of requests for MVC based scorecards, so I am going to kick off a new series of wiring up an MVC scorecard site.  This first part will simply cover setting up the basic site and skeleton framework using the default ASP.NET MVC Project.

Start off by starting a new ASP.NET MVC Project.  Since I will be creating tests for this walk through, be sure to add a unit test project also.  I am just using the default MS-test libraries for now, but feel free to apply whatever test framework you would like.

To create additional views and controllers we’ll add a unit test for a new controller.  I will name this new controller ScorecardController, so I have added a test file called ScorecardControllerTest.cs.  The first test is just the standard action for the appropriate method actions and returning the view, as follows.  I added a similar test for the Index method also.

[TestClass]
public class ScorecardControllerTest
{
    [TestMethod]
    public void Scorecard()
    {
        ScorecardController scorecardController = new ScorecardController();
        var result = scorecardController.Scorecard() as ViewResult;
        Assert.IsNotNull(result);
    }
 
    [TestMethod]
    public void Index()
    {
        ScorecardController scorecardController = new ScorecardController();
        var result = scorecardController.Index() as ViewResult;
        Assert.IsNotNull(result);
    }
}

.csharpcode, .csharpcode pre
{
font-size: small;
color: black;
font-family: consolas, “Courier New”, courier, monospace;
background-color: #ffffff;
/*white-space: pre;*/
}
.csharpcode pre { margin: 0em; }
.csharpcode .rem { color: #008000; }
.csharpcode .kwrd { color: #0000ff; }
.csharpcode .str { color: #006080; }
.csharpcode .op { color: #0000c0; }
.csharpcode .preproc { color: #cc6633; }
.csharpcode .asp { background-color: #ffff00; }
.csharpcode .html { color: #800000; }
.csharpcode .attr { color: #ff0000; }
.csharpcode .alt
{
background-color: #f4f4f4;
width: 100%;
margin: 0em;
}
.csharpcode .lnum { color: #606060; }Once the skeleton implementation is made to get green lights on these tests, a controller will be created with the following code.

public class ScorecardController : Controller
{
    public ActionResult Index()
    {
        return View();
    }
 
    public ActionResult Scorecard()
    {
        return View();
    }
}

.csharpcode, .csharpcode pre
{
font-size: small;
color: black;
font-family: consolas, “Courier New”, courier, monospace;
background-color: #ffffff;
/*white-space: pre;*/
}
.csharpcode pre { margin: 0em; }
.csharpcode .rem { color: #008000; }
.csharpcode .kwrd { color: #0000ff; }
.csharpcode .str { color: #006080; }
.csharpcode .op { color: #0000c0; }
.csharpcode .preproc { color: #cc6633; }
.csharpcode .asp { background-color: #ffff00; }
.csharpcode .html { color: #800000; }
.csharpcode .attr { color: #ff0000; }
.csharpcode .alt
{
background-color: #f4f4f4;
width: 100%;
margin: 0em;
}
.csharpcode .lnum { color: #606060; }

At this point I need to create some tests for what is expected in the view, but I will get to that once a bit more of the skeleton of the site is done.  As soon as I wrote these tests, based on where they are located in my folder structure I decided that I need to do a quick refactor of the name.  Having a Scorecard/Scorecard path just seemed stupid, so I renamed the Scorecard.aspx to Display.aspx and changed the method name appropriately.  If you are following along, the subsequent code will be using the renamed page/method, etc.

The next thing I wanted to do was to get the view coming up appropriately, so first things first, new tests.

[TestMethod]
public void ScorecardViewExists()
{
    ScorecardController scorecardController = new ScorecardController();
    var result = scorecardController.Display() as ViewResult;
    Assert.AreEqual("Display", result.ViewName);
}

.csharpcode, .csharpcode pre
{
font-size: small;
color: black;
font-family: consolas, “Courier New”, courier, monospace;
background-color: #ffffff;
/*white-space: pre;*/
}
.csharpcode pre { margin: 0em; }
.csharpcode .rem { color: #008000; }
.csharpcode .kwrd { color: #0000ff; }
.csharpcode .str { color: #006080; }
.csharpcode .op { color: #0000c0; }
.csharpcode .preproc { color: #cc6633; }
.csharpcode .asp { background-color: #ffff00; }
.csharpcode .html { color: #800000; }
.csharpcode .attr { color: #ff0000; }
.csharpcode .alt
{
background-color: #f4f4f4;
width: 100%;
margin: 0em;
}
.csharpcode .lnum { color: #606060; }

First of course it fails, but with the appropriate change shown, all runs green again.

public ActionResult Display()
{
    return View("Display");
}

So after this I added the following tests, controller actions, and views.

[TestMethod]
public void Select()
{
    ScorecardController scorecardController = new ScorecardController();
    var result = scorecardController.Select() as ViewResult;
    Assert.IsNotNull(result);
}
 
[TestMethod]
public void SelectViewNamed()
{
    ScorecardController scorecardController = new ScorecardController();
    var result = scorecardController.Select() as ViewResult;
    Assert.AreEqual("Select", result.ViewName);
}
 
[TestMethod]
public void IndexViewNamed()
{
    ScorecardController scorecardController = new ScorecardController();
    var result = scorecardController.Index() as ViewResult;
    Assert.AreEqual("Index", result.ViewName);
}

.csharpcode, .csharpcode pre
{
font-size: small;
color: black;
font-family: consolas, “Courier New”, courier, monospace;
background-color: #ffffff;
/*white-space: pre;*/
}
.csharpcode pre { margin: 0em; }
.csharpcode .rem { color: #008000; }
.csharpcode .kwrd { color: #0000ff; }
.csharpcode .str { color: #006080; }
.csharpcode .op { color: #0000c0; }
.csharpcode .preproc { color: #cc6633; }
.csharpcode .asp { background-color: #ffff00; }
.csharpcode .html { color: #800000; }
.csharpcode .attr { color: #ff0000; }
.csharpcode .alt
{
background-color: #f4f4f4;
width: 100%;
margin: 0em;
}
.csharpcode .lnum { color: #606060; }

After that I edited the CSS so I could get a better feel to the site relative to what I am working toward.  I will leave you to decide what you want to do with the CSS & such yourself.  One of these days I will be graphic artists worthy, for now I am just happy with a decent looking layout and reasonable colors. đŸ˜‰

When I was done my Solution Explorer looked like this.

Last I added the following to the Site.Master page for appropriate linkages.  This spot is located in the menucontainer section of the page.

<div id="menucontainer">
    <ul id="menu">
        <li>
            <%= Html.ActionLink("Home", "Index", "Home")%></li>
        <li>
            <%= Html.ActionLink("About", "About", "Home")%></li>
        <li>
            <%= Html.ActionLink("Scorecard", "Display", "Scorecard") %></li>
    </ul>
</div>

.csharpcode, .csharpcode pre
{
font-size: small;
color: black;
font-family: consolas, “Courier New”, courier, monospace;
background-color: #ffffff;
/*white-space: pre;*/
}
.csharpcode pre { margin: 0em; }
.csharpcode .rem { color: #008000; }
.csharpcode .kwrd { color: #0000ff; }
.csharpcode .str { color: #006080; }
.csharpcode .op { color: #0000c0; }
.csharpcode .preproc { color: #cc6633; }
.csharpcode .asp { background-color: #ffff00; }
.csharpcode .html { color: #800000; }
.csharpcode .attr { color: #ff0000; }
.csharpcode .alt
{
background-color: #f4f4f4;
width: 100%;
margin: 0em;
}
.csharpcode .lnum { color: #606060; }

When I run the app I now have a basic skeleton and the initial pages I am going to work with.  Next steps coming soon.

kick it on DotNetKicks.com

Shout it